How Accurate Are AI Calorie Counters? What the Studies Measured, and 5 Places Added Sugar Hides
A photo calorie counter estimates a meal, it does not measure one. Independent tests report a wide error range, from near zero to about 38 percent in research systems, and hundreds of calories per meal in recent app testing. Error enters at all three steps: recognition, portion and database lookup. Added sugar and cooking fat are the hardest things for a camera to see.
How accurate is a photo calorie counter? What independent studies measured
There is no single accuracy number, and any app that gives you one is not telling you much. Different studies measured different things, on different food, against different reference points. Here is what the traceable research actually reports.
| Study | What it measured | Setting | Reported figure |
|---|---|---|---|
| Shonkoff et al., Annals of Medicine, 2023 (systematic review of 52 papers) | Relative error of AI estimates against a known answer | Research systems, 2010 to 2023 | Average relative error 0.10 percent to 38.3 percent for calories, and 0.09 percent to 33 percent for volume |
| Li et al., Nutrients, 2024 (app validity study) | How many food items the image recognition named correctly | 22 images holding 39 food components, consumer apps | MyFitnessPal 38 of 39, Fastic 36 of 39, HealthifyMe 35 of 39; two other apps got 18 of 39 |
| Hengist, Charles and colleagues, NUTRITION 2026 (conference abstract, not yet peer reviewed) | Calories and fat against meals weighed in a metabolic kitchen | 102 standardized meal photos, four photo apps | Underestimated by roughly 250 to 345 calories and about 30 g of fat per meal |
| Panindre et al., IEEE ICMCSI, 2025 (NYU Tandon research model) | How reliably a model finds and labels food in an image | Research prototype, not a shipped app | Mean average precision 0.7941 at an IoU threshold of 0.5 |
Those numbers look contradictory until you read the settings column. A lab study photographing one apple on a white plate is an easier problem than a casserole on a patterned tablecloth. A review pooling 52 papers reports the whole spread, while a single test of four consumer apps reports one average.
The 2026 NIDDK testing is worth a second look because the reference was unusually strict. Meals were built in a controlled metabolic kitchen and weighed to the nearest 0.1 gram. High-fat ketogenic dishes were hardest for the apps, and carbohydrates came out the most consistent. Those results are preliminary until they are published in a peer-reviewed journal.
The honest summary: a photo estimate is usually in the right neighborhood for simple, separated food, and gets loose fast as meals get mixed, saucy or fatty.
Where the error comes from: 3 steps from photo to number
Every AI food tracker does the same three jobs in sequence. Knowing which step failed tells you what to fix at the review screen.
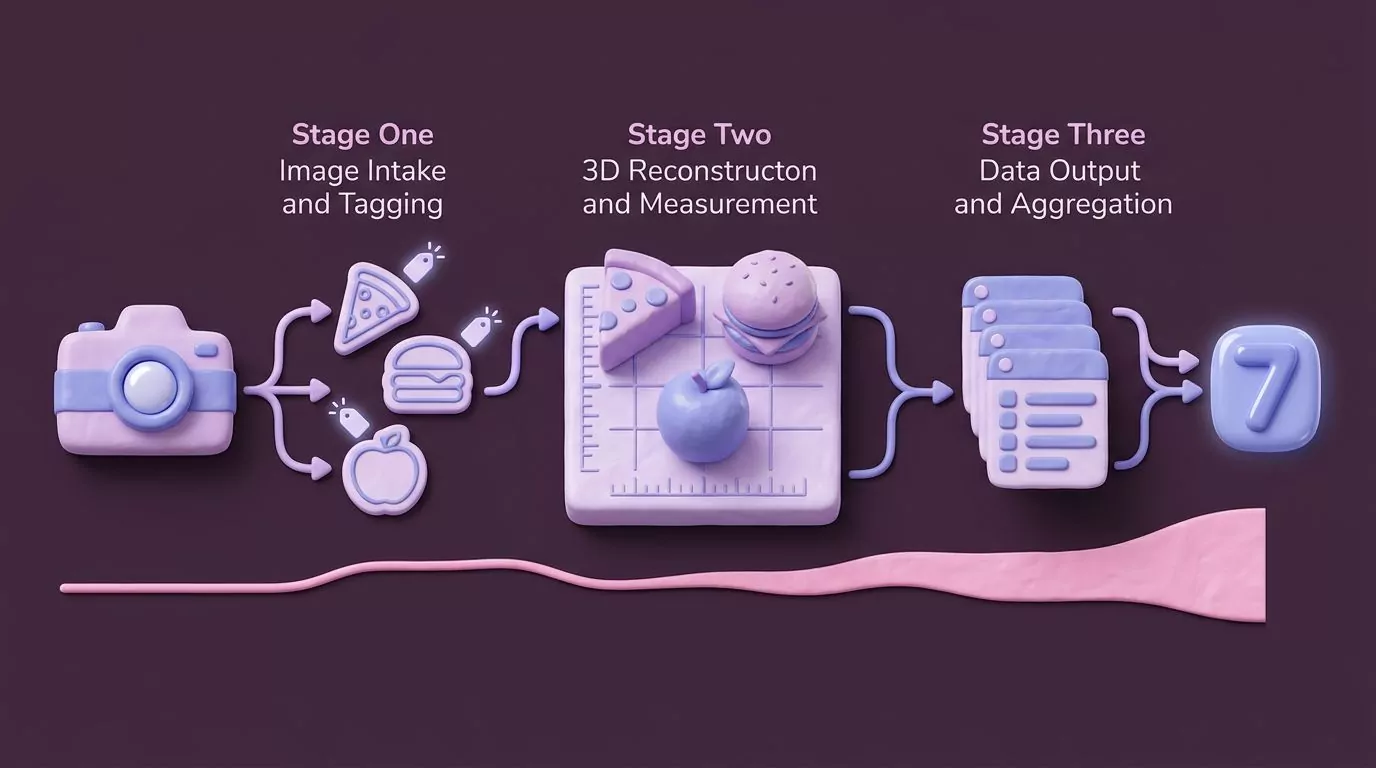
Step 1: Food recognition
The model looks at the image and gives every item a label. It is good at this for common, separated foods, as the Nutrients figures above show. It struggles with look-alikes.
Regular and diet cola are the same brown liquid in the same glass. Mashed potato and mashed cauliflower look identical from above. Whole milk and skimmed milk in a bowl of cereal are one white pour. When the label is wrong, everything downstream is wrong.
Step 2: Portion estimation
Next the app turns a flat image into a volume, then into grams. This is often a major source of error, because one photo has no depth. A bowl can be shallow or deep, and rice can be heaped or level, and both look similar from a single angle.
The Shonkoff review does not name portion estimation as the single biggest problem. What it does show is that simpler images, such as one item on a plate, came with lower error rates. Complexity is the thing that breaks estimates, and portions are one part of that.
Step 3: Nutrition database lookup
Finally the app matches each labeled item to a database entry, takes its per 100 g values, and multiplies by the estimated weight. "Chicken curry" is not one food. Two databases can hold twenty versions of it with different oil, cream and sugar.
That is why two apps can look at the same photo and give you different numbers, and it is covered again in the FAQ below. You can look up common foods yourself with the Sugar in Food Checker, which shows the sugar in 130 everyday foods per serving and per 100 g.
The sugar gap: 5 places added sugar hides from the camera
Added sugar is sugar and syrup put into food during processing, cooking or at the table, as the American Heart Association defines it. It is not the sugar built into whole fruit or plain milk. For the difference in plain language, see what counts as added sugar.
The limits are small. The WHO guideline on sugars intake puts free sugars under 10 percent of daily energy, and suggests under 5 percent for extra benefit. At 2,000 calories that is about 50 g and about 25 g a day.
The AHA sets no more than 6 teaspoons a day for women, about 25 g, and 9 teaspoons for men, about 36 g. To get your own figure, the Daily Sugar Intake Calculator applies those guidelines to your calories.
Here is the problem for any camera. Every figure below is the Added Sugars line on a named US label, and teaspoons use the standard 4.2 g per teaspoon from the Sugar Grams to Teaspoons Converter.
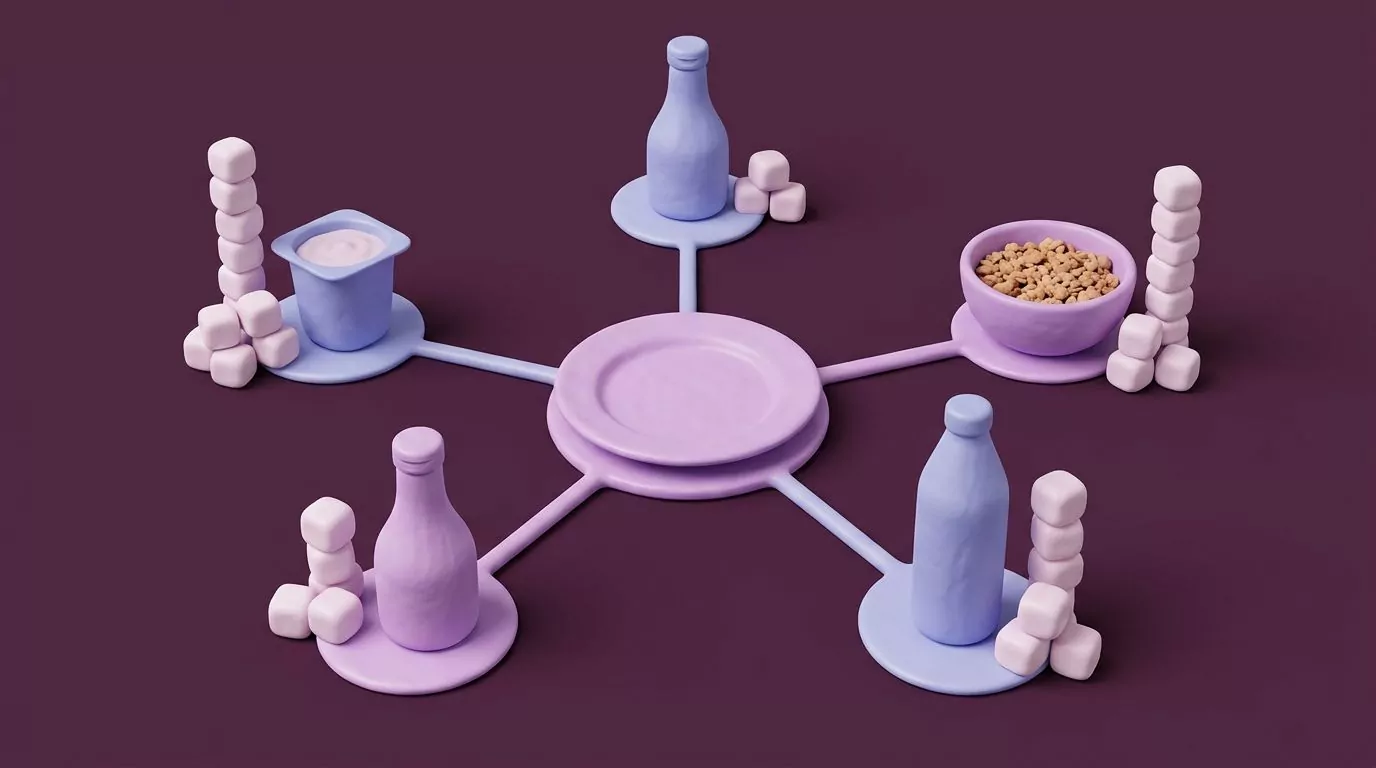
Sauces and glazes
A glaze is sugar painted onto food and then cooked until it disappears into the surface. One tablespoon of Kikkoman Teriyaki Marinade and Sauce carries 3 g of added sugar, about 0.7 teaspoons. Brush three tablespoons over a tray of chicken and you have added roughly 9 g, and the photo shows only chicken.
Dressings
Sweet dressings pool at the bottom of a bowl where a camera cannot see them. Two tablespoons of Marzetti Honey French Dressing list 9 g of added sugar, about 2 teaspoons. That is a salad quietly using a third of the AHA limit for women.
Sweetened drinks
Drinks are the biggest single miss, and the hardest for a photo. Dissolved sugar has no shape. One 18.5 fl oz bottle of Gold Peak Sweet Tea lists 48 g of added sugar, about 11 teaspoons, which is 96 percent of the FDA Daily Value on its own.
A can of cola is in the same territory, as the breakdown of sugar in a can of Coke shows. Tap through a normal day on the Sugar in Drinks Calculator and the total usually surprises people. If soda is the habit you want to break, there are practical ways to stop drinking soda.
Baked goods and granola
Granola looks like oats and nuts, so it reads as plain in a photo. A 2/3 cup serving of Nature Valley Oats and Honey Protein Granola lists 15 g of added sugar, about 3.5 teaspoons, or 30 percent of the Daily Value. Breakfast is a common blind spot, and the same pattern runs through sugar in breakfast cereal.
Flavored dairy and plant milks
These carry natural sugars too, so only the Added Sugars line settles it. A 6 oz cup of Yoplait Original Strawberry lists 18 g of total sugars and 13 g of added sugars, about 3 teaspoons. Oatly Original oatmilk lists 7 g of added sugars per cup, and the company notes that sugar comes from its enzyme process rather than from a sweetener, which the FDA still counts as added.
None of this is visible. A camera cannot show you sugar stirred into a sauce, glazed onto meat, dissolved in a bottle or blended into a cup. It can only show the food around it. To see what a number like 48 g costs you in calories, the Sugar to Calories Calculator does the conversion, and the math behind it is in calories in a gram of sugar.
Label, plate photo or manual entry: which to use when
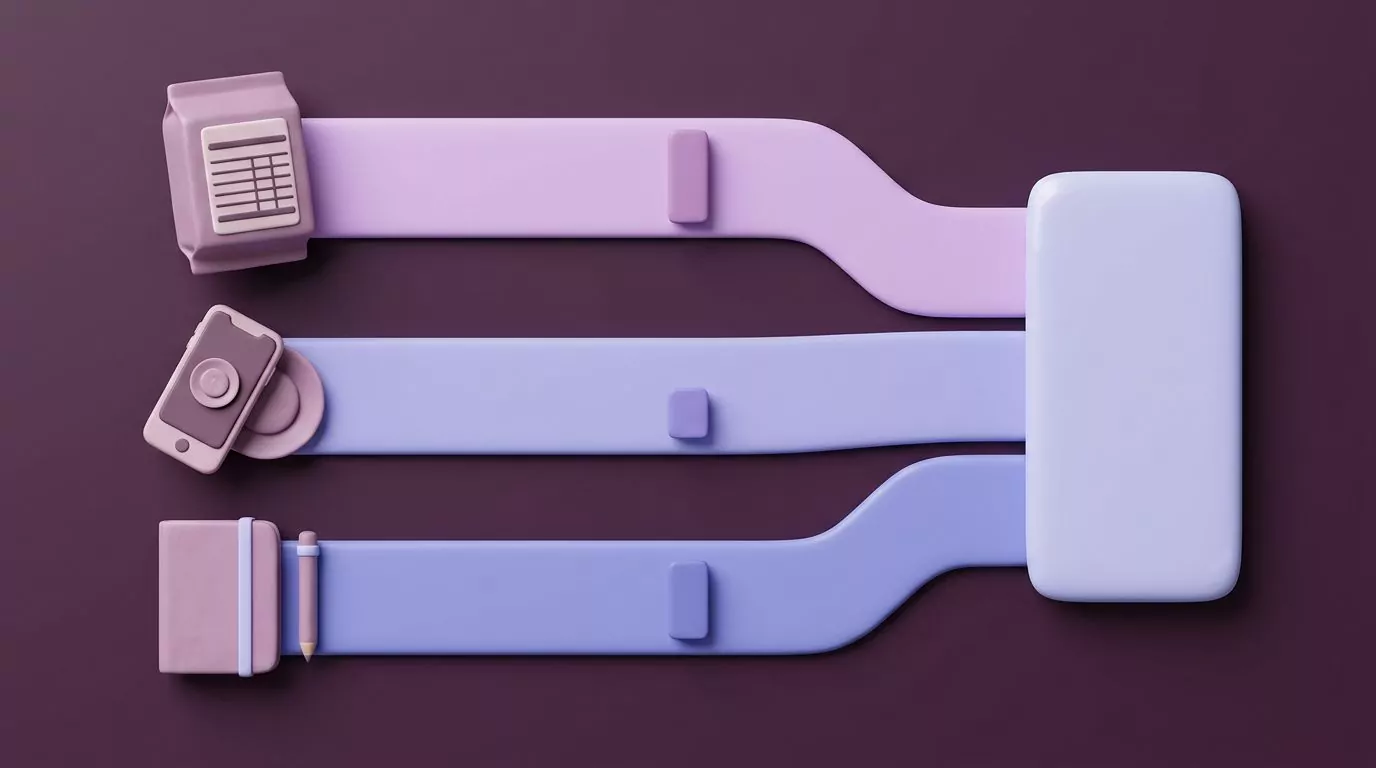
Each logging method is good at something different. Pick by what is in front of you rather than using one method for everything.
| What you are logging | Best source for added sugar | Why a photo falls short | Free tool |
|---|---|---|---|
| Packaged food | The Added Sugars line on the Nutrition Facts label | The camera sees the bowl, not the panel on the box it came from | Hidden Sugar Finder, which highlights 90 names sugar hides behind in an ingredient list |
| A home recipe | The sugar and syrup you added, totaled from your own ingredients | Once it is baked or stirred in, nothing you added is visible | Free Printable Sugar Log, to write down the day's added sugar |
| A restaurant plate | The chain's published figures where they exist, otherwise your own estimate at review | Glaze, dressing and sauce are already on the plate when it arrives | Sugar in Food Checker for a reference figure on common foods |
| Drinks | The bottle's Added Sugars line, or the chain's own numbers | Sugar in a liquid has no shape, so a photo tells you nothing | Sugar in Drinks Calculator for a whole day of drinks |
In the UK the panel reads "of which sugars". The NHS treats that as total sugars, and calls more than 22.5 g per 100 g high and 5 g or less per 100 g low. It is not the same line as US Added Sugars. If that is the label in your hand, the Food Label Sugar Decoder takes the "of which sugars" number and returns the traffic-light rating and the per-serving grams.
3 photo habits that catch the sugar a camera misses
You cannot fix recognition or portion math from the outside. You can give the model a better image and fix the rest yourself.
- Shoot in natural light. Warm indoor bulbs shift color, and color is part of how a model tells foods apart.
- Use one consistent angle. Overhead or about 45 degrees shows separation between items instead of stacking them into one shape.
- Keep the bottle or packet in the frame. The label beside the plate is the only part of the picture that states added sugar in grams.
Then add what the camera never saw, at the review step, before you confirm. Sauce, dressing, syrup and anything you stirred into a drink go in by hand. For anything packaged, read the Added Sugars line rather than guessing from the ingredient list.
Two seconds of correction at review beats a perfect photo. The estimate is a starting point, not a verdict.
Check the portion before you confirm an estimate
A portion is how much you choose to eat. A serving is the amount printed on the label, and NIDDK is blunt that the serving size on a label is not a recommendation of how much you should eat. Those two numbers get confused constantly, in your head and in the app.
| Food | What the NIDDK page shows | Why it changes a photo estimate |
|---|---|---|
| Frozen lasagna | Serving size 1 cup, 4 servings per container, 280 calories per serving | Eating half the tray is two servings, so the honest figure is double |
| Ice cream | The label serving changed from 1/2 cup to 2/3 cup | A bowl that used to be one serving may now be scored differently |
| Yogurt | The label serving changed from 8 ounces to 6 ounces | Cup sizes vary by brand, so the added sugar per cup varies too |
| Chocolate chip cookies | 5 medium-sized cookies, 345 estimated calories in NIDDK's sample tracker | Cookie size is the whole estimate, and a photo flattens size |
| Soft drink | 12 fl oz, 136 estimated calories in the same tracker | A 20 oz bottle is not a can, and the app cannot tell from the glass |
So before you tap confirm, ask one question: is the app's portion closer to what I actually ate, or to the label serving? If it is short, raise it. A portion you corrected is the only one worth measuring against your daily sugar limit. That single habit fixes more error than any camera trick.
Privacy: 4 questions to ask any food photo app
You are handing a company photographs of your kitchen, your desk and your family table, several times a day. Ask before you install, not after. The answers live in the privacy policy, the App Store privacy labels and the in-app settings.
- Where does the log live? On the device, in the company's cloud, or both. That decides who else can ever read it.
- What happens to the photo? Uploaded for processing, processed on the device, kept afterwards, or deleted. These are four different answers, so look for the specific one.
- Is any of it used for advertising? Check whether food and health data is shared with ad or analytics partners, and whether you can turn that off.
- Can you delete it, and how completely? Look for deletion of individual entries and of the whole account, not just a sign-out.
If an app cannot answer these in plain language on its own store listing, that is your answer.
How Sugar Lens handles photo estimates
Sugar Lens is a photo app that estimates added sugar in grams, not a calorie counter. You photograph your food, it produces an estimate, and you review and confirm every entry before it saves. The day is then shown against the WHO and AHA limits, and the sugar log stays on the device.
The same photo limits described in this article apply to it. A camera cannot see sugar that was stirred in, glazed on or dissolved, so the review step is where you add it. If you want the guideline numbers first, start with how much sugar per day, or compare limits across ages in sugar intake by age.
It is listed on the App Store as "Sugar Tracker: Food Scanner", free to download, for iPhone running iOS 15.1 or later. There is no Android version yet.
Frequently Asked Questions
Why do two AI calorie counters give different numbers for the same meal?
Because they rarely agree on all three steps. One may label your bowl "pad thai" and the other "rice noodles with chicken", and each then pulls a different database entry with different per 100 g values. Multiply that by two different portion estimates and the totals drift apart. The gap is a database and portion disagreement, not one app being broken.
Are calorie counts on nutrition labels accurate?
They are regulated, which is not the same as exact. Under 21 CFR 101.9(g), a food declaring calories, total sugars, total fat, saturated fat or sodium is misbranded if a tested composite runs more than 20 percent above the declared value. Reasonable shortfalls below the labeled amount are allowed under good manufacturing practice. Even so, a label beats a plate photo, because it states what the manufacturer actually put in.
Do photo calorie counters work for drinks and smoothies?
Poorly, and for a physical reason. A photo can only judge liquid volume, and volume tells you nothing about what is dissolved in it. Sweetened and unsweetened versions of the same drink look identical, which is why the sweetened drinks item above matters. Log drinks from the bottle's Added Sugars line or the chain's published figures instead.
Can a photo calorie counter tell cooking oils or butter apart?
Usually not, and the amount matters more than the type anyway. USDA FoodData Central puts olive oil at 884 calories per 100 g, about 119 calories per tablespoon, and salted butter at 717 calories per 100 g, about 102 calories per tablespoon. The gap between them is roughly 17 calories, while a second tablespoon of either adds around 100. So add the fat at review by how much went in the pan, not by which one it was.
Where to start
If you want your own daily limit first, run your numbers through the Daily Sugar Intake Calculator. If you would rather just start logging, Sugar Lens is free on the App Store and takes a few seconds a meal.
This article is general information, not medical advice. People with diabetes or another condition should follow the numbers their clinician gives them.